 Profiler Source Generation Update – BB – Update 8
Posted: January 2, 2024
Last Updated: January 2, 2024
Profiler Source Generation Update – BB – Update 8
Timeframe: December 19, 2024 – December 30, 2024
Last update, I showed a little demo graph of the time it takes the NSprites rendering system to run while improving the rendering efficiency with texture maps. Here’s the thing: I liked the little profiler graph that told me how long the rendering system was taking. Wouldn’t it be nice to have that graph for other systems in the game? Yes, it would be nice and yes, I did take a 10 day tangent to make it work. This update is mostly about my escapades with Unity’s ECS C# source generation and my ups and downs with it. A deep dive is at this link, but the generalities of this update are on the current page.
HIGHLIGHTS:
Profiler Source Generation:
- JobProfilerAttribute: Decorate a system with [JobProfiler(…)] to generate setup code.
- SetupJobProfilers: Generated method to be called in OnCreate to set up NativeText key fields for profiling
- DisposeJobProfilers: Generated method to be called in OnDestroy to dispose of NativeText key fields.
- Profiler_Run: Generated method that measures/estimates the runtime of the provided job. The provided IJobEntity is called with Run(), and is run on the main thread. Surrounding calls to start and stop the profiler are also called with Run().
- Profiler_Schedule: Generated method that measures/estimates the runtime of the provided job. The provided IJobEntity is called with Schedule(). Surrounding calls to start and stop the profiler are also called with Schedule and the JobHandle of the logic job is returned as a dependency.
- Profiler_ScheduleParallel: Generated method that measures/estimates the runtime of the provided job. The provided IJobEntity is called with ScheduleParallel(). Surrounding calls to start and stop the profiler are called with Schedule and the JobHandle of the logic job is returned as a dependency.
COOL NEW UTILITIES:
Stopwatches:
- IStopwatchInfo: Interface that exposes properties measured/calculated by a stopwatch such as a window of times or a min, max, or average time in the window.
- IStopwatchInfoProvider: Interface that defines methods for retrieving IStopwatchInfo.
- StopwatchGroup: A class implementing IStopwatchInfoProvider that returns summed information from any child StopwatchGroups or StopwatchRecorders. Get an IStopwatchInfo instance by querying the StopwatchGroup with a string representing a path to the provider, e.g. “Update/Bullet/Movement”. You may query for an IStopwatchInfo for a group by simply using a key higher up in the path, e.g. “Update/Bullet” would get the summed time for all recorders under the “Update/Bullet” group like “Movement”, “Accelerate”, “Drag”, etc.
- StopwatchTracker: Quick fix to basically just query a static StopwatchGroup for info retrieval.
Line Rendering:
- Added LinePlotSettings for minimal line configuration such as thickness and color. Can add more setting fields later.
PS: Happy New Year!
Video Demos
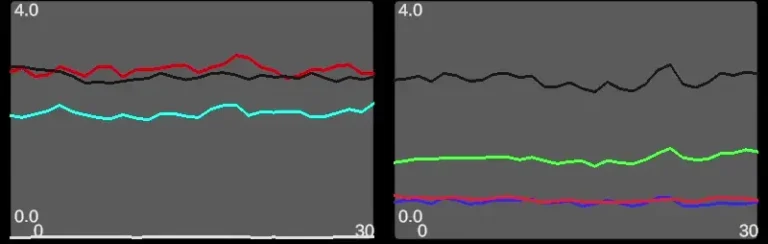
Timings for various jobs/systems. The scale on the left is in milliseconds of runtime. Tests had about 80,000 bullets. Left: Red=Firing point logic, Cyan=Sprite rendering logic, Black=Combined bullet movement logic. Right: Black=Combined bullet movement logic, Green=Bullet position update, Blue=Bullet acceleration update, Red=Bullet jerk update. Notice how the total (black) adds up from all the sub-parts.
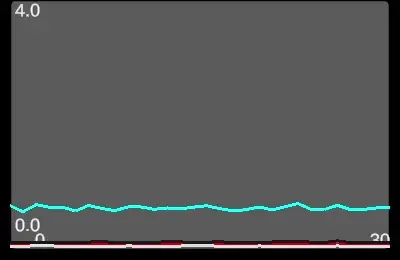
A quick experiment with 5000 enemies. They don’t have any firing points, but I just wanted to know what the timing would be like.